.png)
Every D2C operator we know is sitting on more data than they’ve ever had. Shopify exports, Meta dashboards, weekly support ticket dumps, inventory sheets by variant, return rate breakdowns by product. The data stack is deep and getting deeper.
And yet, every week starts with someone in your team manually pulling a pivot table to figure out what happened last week.
Contrary to popular belief, the bottleneck in most D2C operations is not data. It’s the time between data and decision.
Most teams spend their best hours formatting, compiling, and reconciling before they even get to the actual thinking. The analysis that should take 30 minutes takes half a day. Claude Cowork is built to close that gap.
We hosted a session for 200+ D2C operators from across the Elevation portfolio to show how Claude Cowork can run your business ops and do the heavy lifting for you. The Elevation team, Vartika Bansal, AI Operations Partner, and Harsh Agrawal, CTO in Residence, delivered tactical guidance tailored to D2C teams.
This playbook is the companion resource to that session. It covers the five Claude Cowork use cases demonstrated during the workshop, with exact prompts, file setup instructions, and follow-up variations you can run with your own data today.
Download the prompt handbook to get started with Claude Cowork and try any of these workflows with your own data.
What is Claude Cowork?
Claude Cowork is a desktop AI agent from Anthropic. You connect it to a folder on your computer and describe a task through a prompt. The tool executes the work end to end: reading your source files, processing them, and writing a ready-to-use output back to the same folder.
This is meaningfully different from how chat-based AI tools work.
When you use ChatGPT or the Claude web interface, you:
- Paste data into a conversation window
- Receive a text response and do some back-and-forth
- Manually apply that response to your actual documents
Every time a file gets updated, you restart the cycle.
Cowork removes this loop entirely. It reads your actual files, whether Excel spreadsheets, CSVs, PDFs, or Word documents, works within them, and produces usable outputs in a format of your choice.
Since Cowork reads directly from the folder you point it to, there’s no hassle of copying-pasting new information. Outputs arrive ready to use without reformatting. And the workspace persists across sessions, which matters for multi-step workflows that build on each other over days.
Why D2C Operators Need Claude Cowork
The reason most D2C brands have not fully closed the gap between data and decision is structural.
The current workflows to go from raw data to actionable insight involve too many manual steps, too much formatting effort, and too many hours spent asking the same questions week after week. Claude Cowork changes that structure in five specific ways.
1. Cowork improves your data processing bandwidth
Most D2C brands are generating more data than ever. But the problem is that someone has to sit down and process it manually before it becomes a decision.
Hours and days go into that processing step, pulling the weekly sales comparison, building the inventory health view, cross-referencing Meta spend with Shopify revenue. This is where teams lose the week before they have even started the high-value strategic thinking. Cowork compresses this timeline significantly.
2. Cowork enables proactive > reactive diagnosis
By the time a stockout shows up in a report, you’ve already lost sales on a fast-moving SKU. And by the time a sales drop appears in your monthly review, the window to act has narrowed considerably.
Most D2C ops teams are running a week or two behind the actual state of the business because the reporting cadence isn't optimized for a faster pace. Cowork drives the shift from reactive reporting to proactive flagging with health checks running before problems show up.
3. Small teams can operate at a higher capacity
Many D2C brands run lean ops teams. The analytical work that a full-time analyst or an agency would handle is either done inconsistently or tabled.
Cowork can increase the ratio of analytical capacity to team size. A two or three person ops team can now cover ground that previously required dedicated headcount or an external partner.
4. Build automated workflows for recurring analysis
The most valuable analyses in D2C are also the most repetitive: inventory health every week, sales velocity every month, ads performance every Monday. The time cost of these analyses often comes down to the manual trigger, the file preparation, and the formatting.
Once a prompt is working reliably, Cowork can run it on an automated schedule and deliver the output before anyone has asked for it.
5. Cowork retains institutional knowledge
When your best analyst or ops manager leaves, their approach to a problem usually leaves with them.
But Cowork prompts are documented, shareable, and reusable. The logic behind how your team diagnoses a sales drop, scores inventory health, or reads ad performance gets encoded in a prompt that anyone on the team can run. The analytical capability becomes organizational rather than individual.
5 Ways to Use Claude Cowork in D2C Operations
Let’s look at the five use cases covered during our session, each with the exact prompt used in the live demo, the files required to run it, and more.
Use Case 1: Inventory Health Tracker
With hundreds of SKUs across sizes and colours, no one has a clear picture of what is critical until stock actually runs out. Health checks happen reactively, triggered by a complaint or a stockout notification rather than a regular process, which means the ops team is always catching up rather than getting ahead.
How to use Claude Cowork for tracking inventory health
Cowork calculates Days on Hand, aging, and size set completeness for every SKU, then scores each one across a composite health rating: Healthy, Moderate, At Risk, Critical, or Stocked Out.
The output is a prioritised action list for the ops team, covering:
- What to reorder urgently based on 90-day sales velocity
- Which product-colour combinations have a broken size set
- Which SKUs to leave alone
The entire analysis, across your full catalogue, runs in a single session.
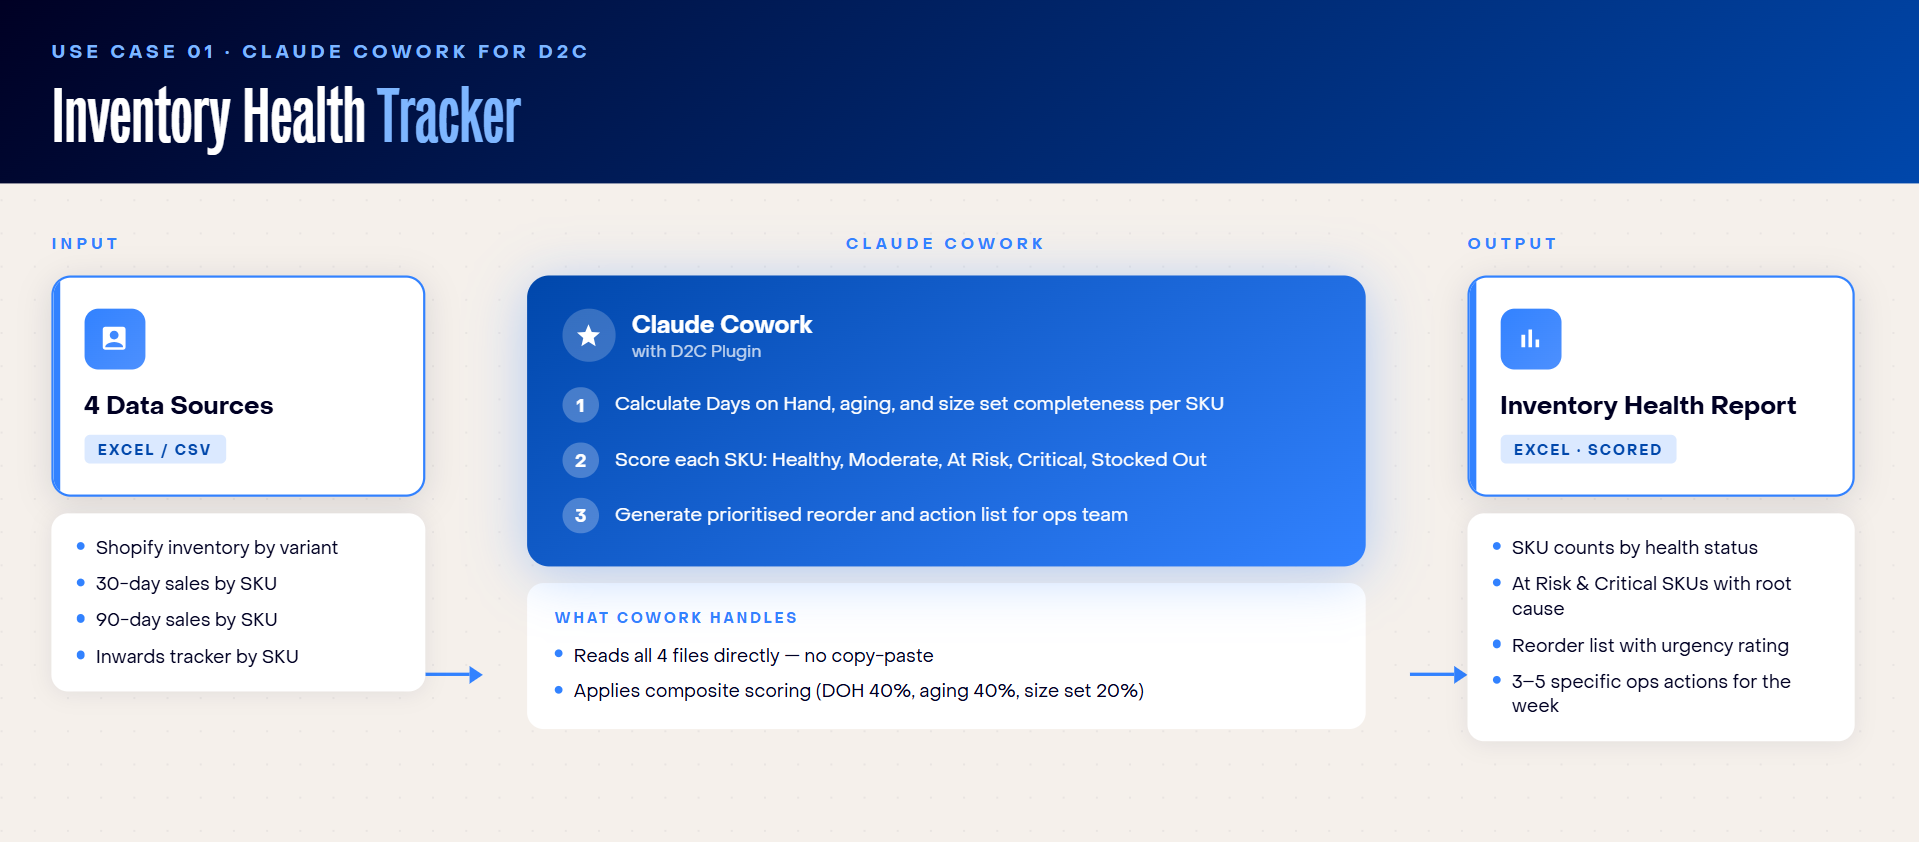
Files needed:
- Current inventory by variant, exported from Shopify or your warehouse management system
- 30-day sales by SKU
- 90-day sales by SKU
- Inwards tracker showing when each SKU was received
Prompt:
Follow-up prompts:
- For the Critical SKUs, which ones have incoming stock in the inwards tracker? Remove those from the urgent reorder list.
- Which product lines have the highest proportion of broken size sets? Rank them and flag the ones where the gap is concentrated in a single size.
Use Case 2: Sales Velocity Drop Diagnosis
Sales drops appear late, usually in the monthly report, by which point the window to act has already narrowed. The more costly problem is that teams rarely cross-reference a falling product against what is actually in stock.
The result is a consistent misdiagnosis: promoting a product that is stocked out in key sizes, which generates impressions but not conversions; or reordering a product that customers have genuinely stopped buying, which compounds the dead stock problem.
The two scenarios call for completely opposite responses, but they look identical in a sales report.
How to use Claude Cowork for identifying sales velocity drop
Cowork calculates period-over-period velocity change per product and diagnoses every flagged drop as either an inventory problem or a demand problem.
- If core sizes are stocked out, the drop is an inventory problem: reorder, do not promote.
- If the full size set is available but sales are falling, it is a demand problem: investigate creative and pricing, do not reorder.
Cowork also flags products where return rates increased across the same period, which is a separate quality signal that points to a different kind of problem entirely and needs a different response.
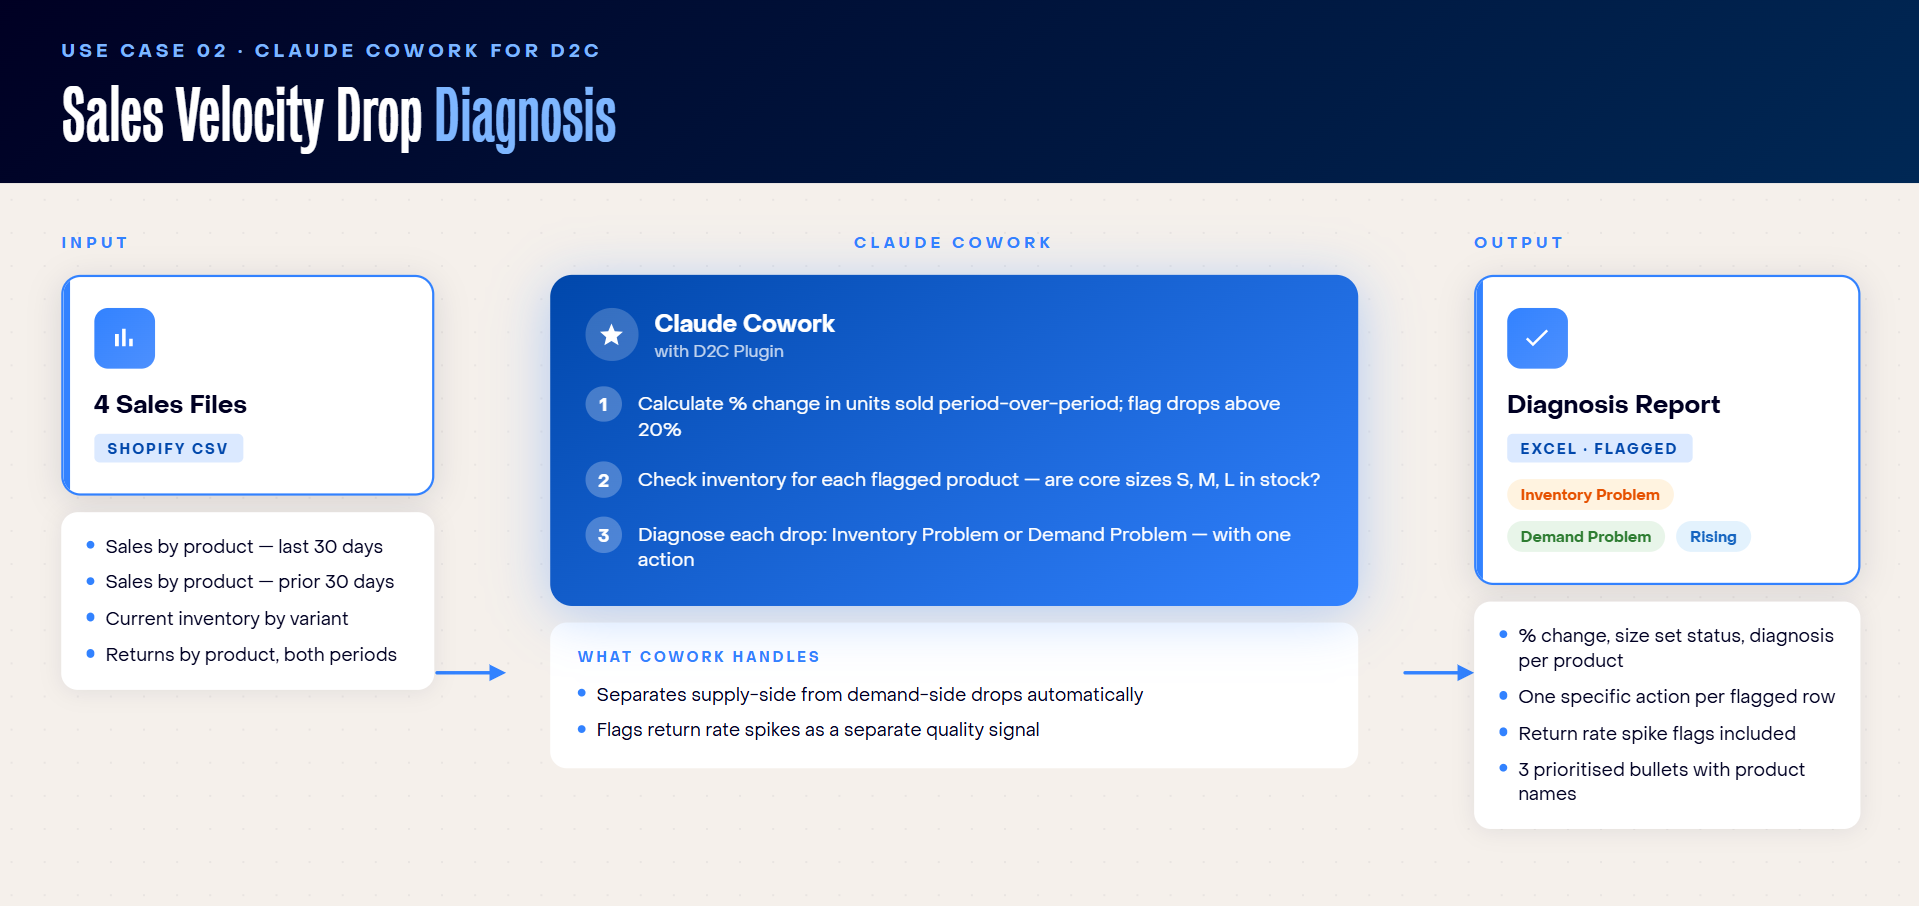
Files needed:
- Shopify’s Total sales by product exports for last 30 days
- Shopify’s Total sales by product exports for the 30 days before that
- Current inventory by variant with size and colour breakdown
- Returns by product for both periods
Prompt:
Follow-up prompts:
- For [product name]: which specific sizes are stocked out in which colours? Estimate the revenue lost due to unavailability during the period.
- For demand-problem products: do their return reasons suggest a product fit issue, a colour accuracy issue, or something else? Based on return reasons and current Days on Hand, should any of these be marked down rather than waited out?
Use Case 3: Meta Ads ROAS Analysis
Meta reports the ROAS it can attribute, which leaves out a meaningful portion of actual conversions driven by paid spend. There is no straightforward way to see actual return on spend per product based on real Shopify revenue, and the gap between those two numbers is where budget decisions go wrong.
Winning and losing products can look identical on the Meta dashboard when attribution coverage is low. Brands end up scaling products that are underperforming and holding back on products where organic demand is building without needing the support.
How to use Claude Cowork for analyzing meta ads ROAS
Cowork calculates a blended ROAS per product using Shopify net sales divided by Meta spend, operating entirely outside Meta's own attribution. It flags products where blended ROAS falls below threshold, where the business is overly dependent on paid traffic, and where organic demand is building faster than ad spend. That last category is where you should hold back, not scale up.
The output is a one-row-per-product table with a specific implication for each flag, structured so the performance team can act on it immediately.
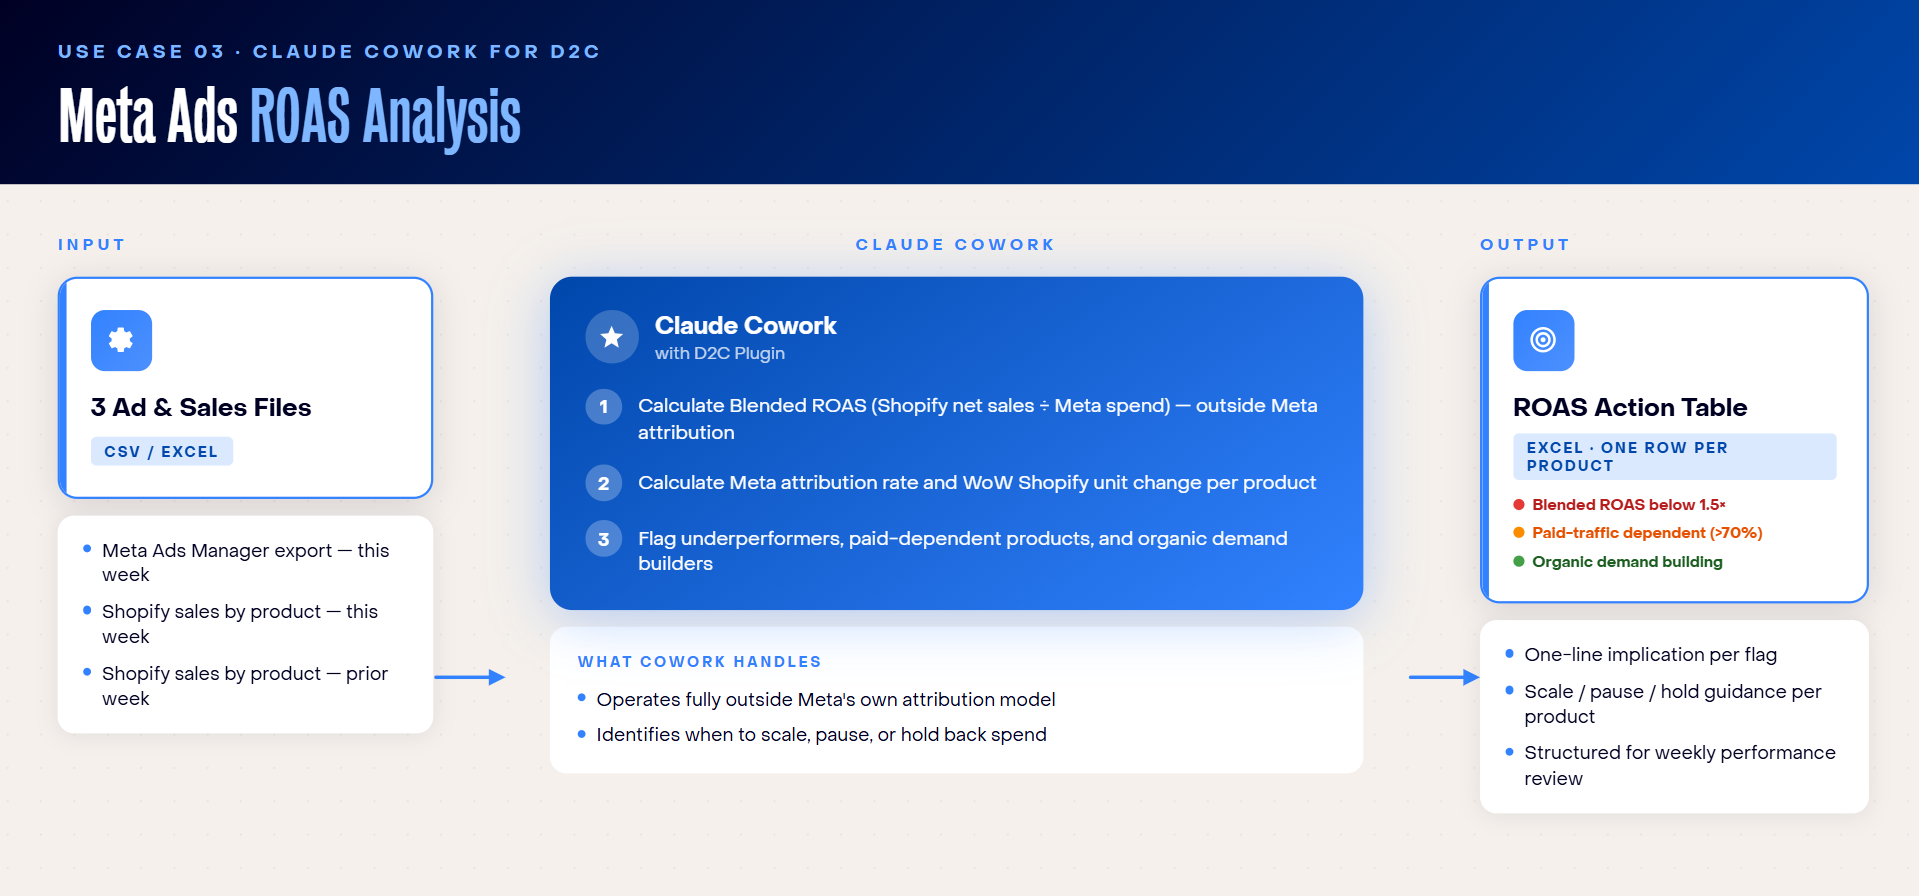
Files needed:
- Meta Ads Manager export at campaign level, including spend, purchases, and reported ROAS
- Shopify sales this week by product
- Shopify sales prior week by product
Prompt:
Follow-up prompts:
- Which products should I scale spend on this week and which should I pause? Rank by opportunity, using blended ROAS as the primary signal.
- For the products with organic demand building, what would blended ROAS look like if I cut Meta spend by 30%? Would any of them justify a full pause?
Use Case 4: Customer Support Ticket Analysis
A lot of D2C teams track refund volumes but not the root causes.
A sizing complaint, a wrong-item dispatch, and a quality defect all register as one ticket each in the count, but each needs a completely different fix from a completely different team. When those distinctions are invisible in the data, all three get the same generic response, and the underlying problem compounds.
Low-CSAT tickets have the same pattern: they get resolved and closed without anyone understanding what specifically went wrong in how the issue was handled.
How to use Claude Cowork for analyzing customer support tickets
Two linked workflows address this. The first reads and classifies every refund ticket description by root cause, then connects those patterns to their operational source: fulfillment, supplier, or photography. The second analyses all low-CSAT closed tickets to understand how resolutions are failing, broken down by channel, ticket type, and what the resolutions actually say.
Together, these two workflows give the ops and sourcing team something they rarely have: a structured view of where the customer experience is breaking down and what specifically to fix.
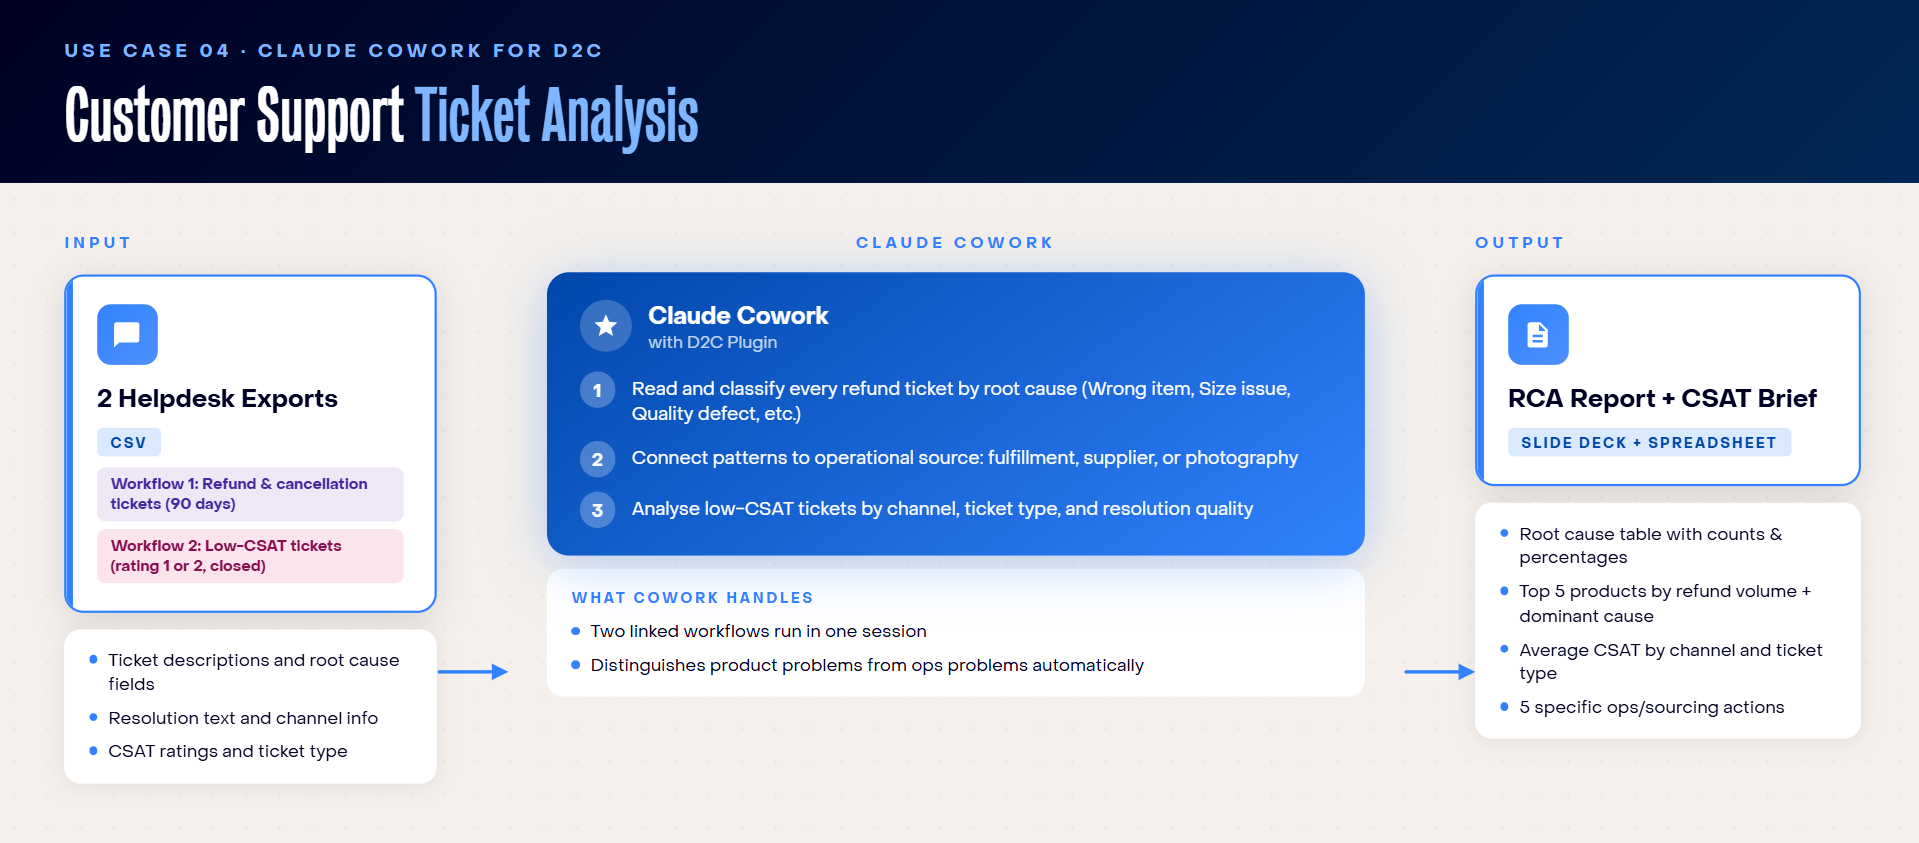
Files needed:
- Helpdesk CSV export filtered to refund and cancellation requests for the last 90 days
- Separate export of all tickets with a satisfaction rating of 1 or 2 (closed), for the CSAT workflow
PROMPT 1: REFUND ROOT CAUSE ANALYSIS
PROMPT 2: LOW CSAT INVESTIGATION
Follow-up prompts:
- For the top 3 refund root causes, which teams need to act and what specifically should each team do in the next two weeks?
- Draft a brief for the sourcing team on the quality defect findings, including the specific products affected and the volume of complaints per product.
Use Case 5: Event-Based Demand Forecasting
There is no structured view of which events actually drive uplift for which products, and the absence of that view has compounding costs.
Reorders happen too late because no one ran the numbers on what Diwali or the payday week actually does to demand for a specific product line. Discount calendars get built without demand data, so organic demand days get discounted unnecessarily. Paid campaigns go live on the wrong days because the decision was made by feel rather than by forecast.
Each of these inefficiencies can cost margin, inventory accuracy, or wasted spend.
How to use Claude Cowork for forecasting event-based demand
Cowork quantifies historical demand uplift per event type, across festivals, payday weeks, weekends, and normal weekdays, using six months of daily sales data. It then builds a week-by-week forecast for the next four weeks anchored to the Indian calendar.
The output is a concrete planning brief: which product lines need inventory confirmed and by when, which days to run paid Instagram, which events warrant a discount and at what depth, and which events will drive demand organically and should be left alone.
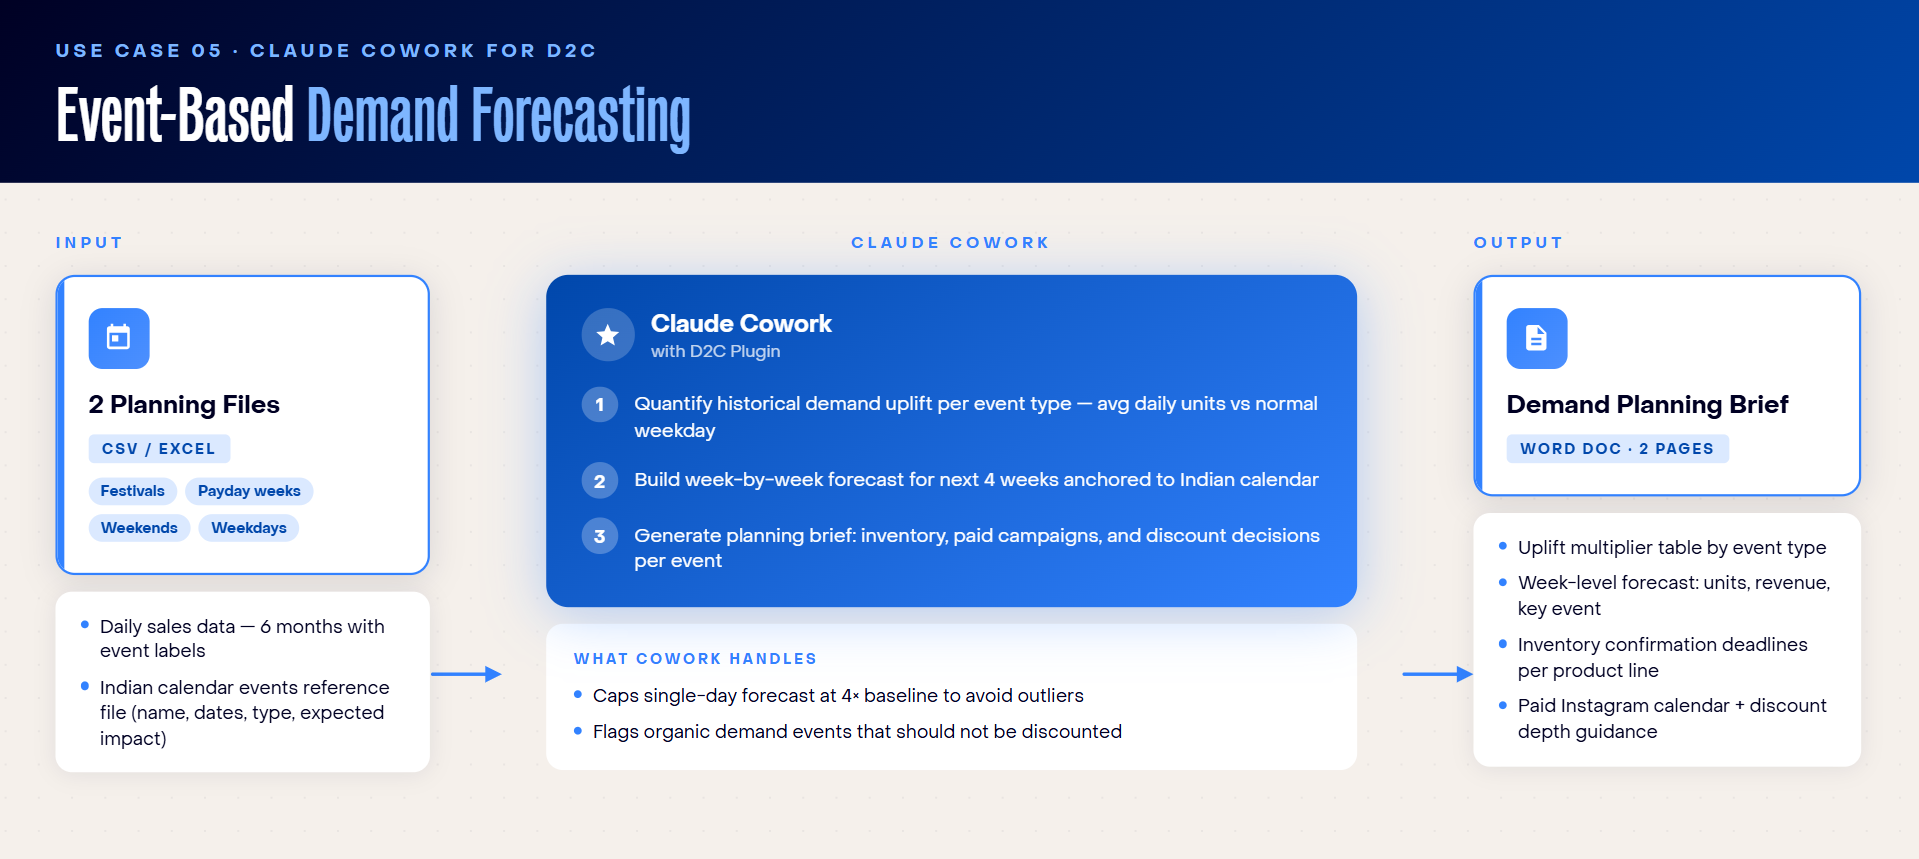
Files needed:
- Daily sales data for at least six months, with event labels by day. Shopify does not produce this natively, so you export daily sales by product and add event labels in a Google Sheet using a reference calendar.
- Indian calendar events reference file with event names, start and end dates, type, and expected demand impact. Claude can generate this file for you once. You maintain and update it annually.
Prompt:
Follow-up prompts:
- Which product lines are most sensitive to event-driven demand? Rank them by average uplift multiplier across all event types.
- Build a paid campaign calendar for the next 30 days with recommended daily budget ranges, using expected demand uplift as the primary input.
Your Guide to Prompting Claude Cowork Like a Pro
Cowork is only as good as the instructions you give it. The gap between a prompt that produces a generic output and one that produces something you can act on immediately almost comes down to four elements.
1. Role
Set the frame before anything else. Telling Claude "you are an ops analyst for a D2C apparel brand" shapes every output that follows. Without this framing, Claude defaults to a generic context that produces generic results.Starting with a role is the single highest-leverage thing you can do to improve the quality of the first output.
2. Context
Name the files, the date, the brand, the benchmarks. Claude does not automatically carry over context between sessions, so everything it needs should be in the prompt or the working folder. The more precisely you describe the context, the more precisely Claude can work within it.
3. Rules
Constraints sharpen outputs significantly. Telling Claude to flag only products down more than 20% is more useful than asking it to look for drops. Giving it a scoring rubric, urgent reorder if 10 or more units sold, review if between 1 and 10, do not reorder if zero, means it can apply that rubric consistently across every row without you having to check its reasoning case by case.
4. Output format
Tell Claude exactly what to produce: a spreadsheet, a Word document, a slide deck, a table with one action per row.
If you do not specify the format, the output will likely be correct in substance but wrong in structure, and you will spend time reformatting something that was otherwise right. Specifying format is not extra work; it is how you get a file you can use directly.
How to Get Started with Claude Cowork
You don’t need a technical setup or a complete overhaul of your existing workflows to get started with Cowork. The fastest path to value is to pick one use case you already understand well, run it with real data, and check whether the output matches what you already know.
Step 1: Complete the setup
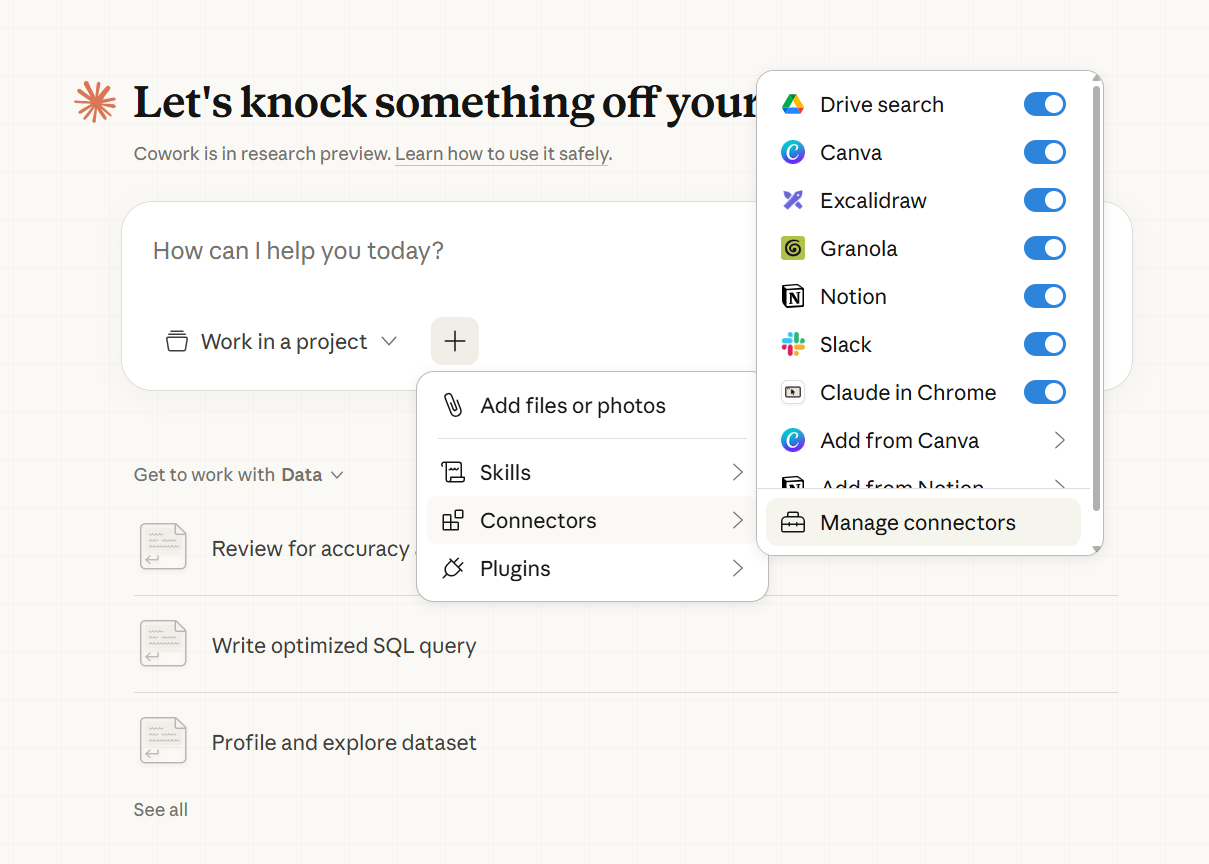
Download the Claude desktop app from claude.ai, available on Mac and Windows. Activate Cowork and connect relevant apps like Google Drive or Gmail. You can do this by clicking the + icon and clicking Connectors.
If you want to connect an app, press Manage connectors. This will give you a list of available tools you can add to your Cowork account.
Select a working folder on your machine and point Cowork to it. Everything Cowork reads and writes will flow through this folder.
Step 2: Start with a task you already know the answer to
Run the Inventory Health Tracker on your last Shopify export and check whether the Critical SKUs match what your ops team already suspected.
Drop two months of sales CSVs and run the Sales Velocity Drop analysis, then check whether the inventory-versus-demand diagnoses hold up against your existing knowledge.
Starting here means you are evaluating Cowork's output against a reference point you trust, which is a much faster way to build confidence than starting with a problem where you have no baseline.
Step 3: Iterate on your prompts
If the first output is not quite right, do not patch it manually. Refine the prompt instead and run it again from scratch. A better prompt that produces a reliable output is more valuable than a one-time workaround, because it can be reused and shared. Keep a record of prompts that work well.
Step 4: Build recurring workflows
Once a prompt is producing consistent results, save it as a skill or scheduled task. A weekly inventory health check, a weekly ads digest, a monthly demand forecast.
At this point, Cowork moves from a personal productivity tool to a team-level process, a shared library of prompts that anyone on the ops team can run against fresh data each week.
FAQs about Claude Cowork
1. Is my data secure with Claude Cowork?
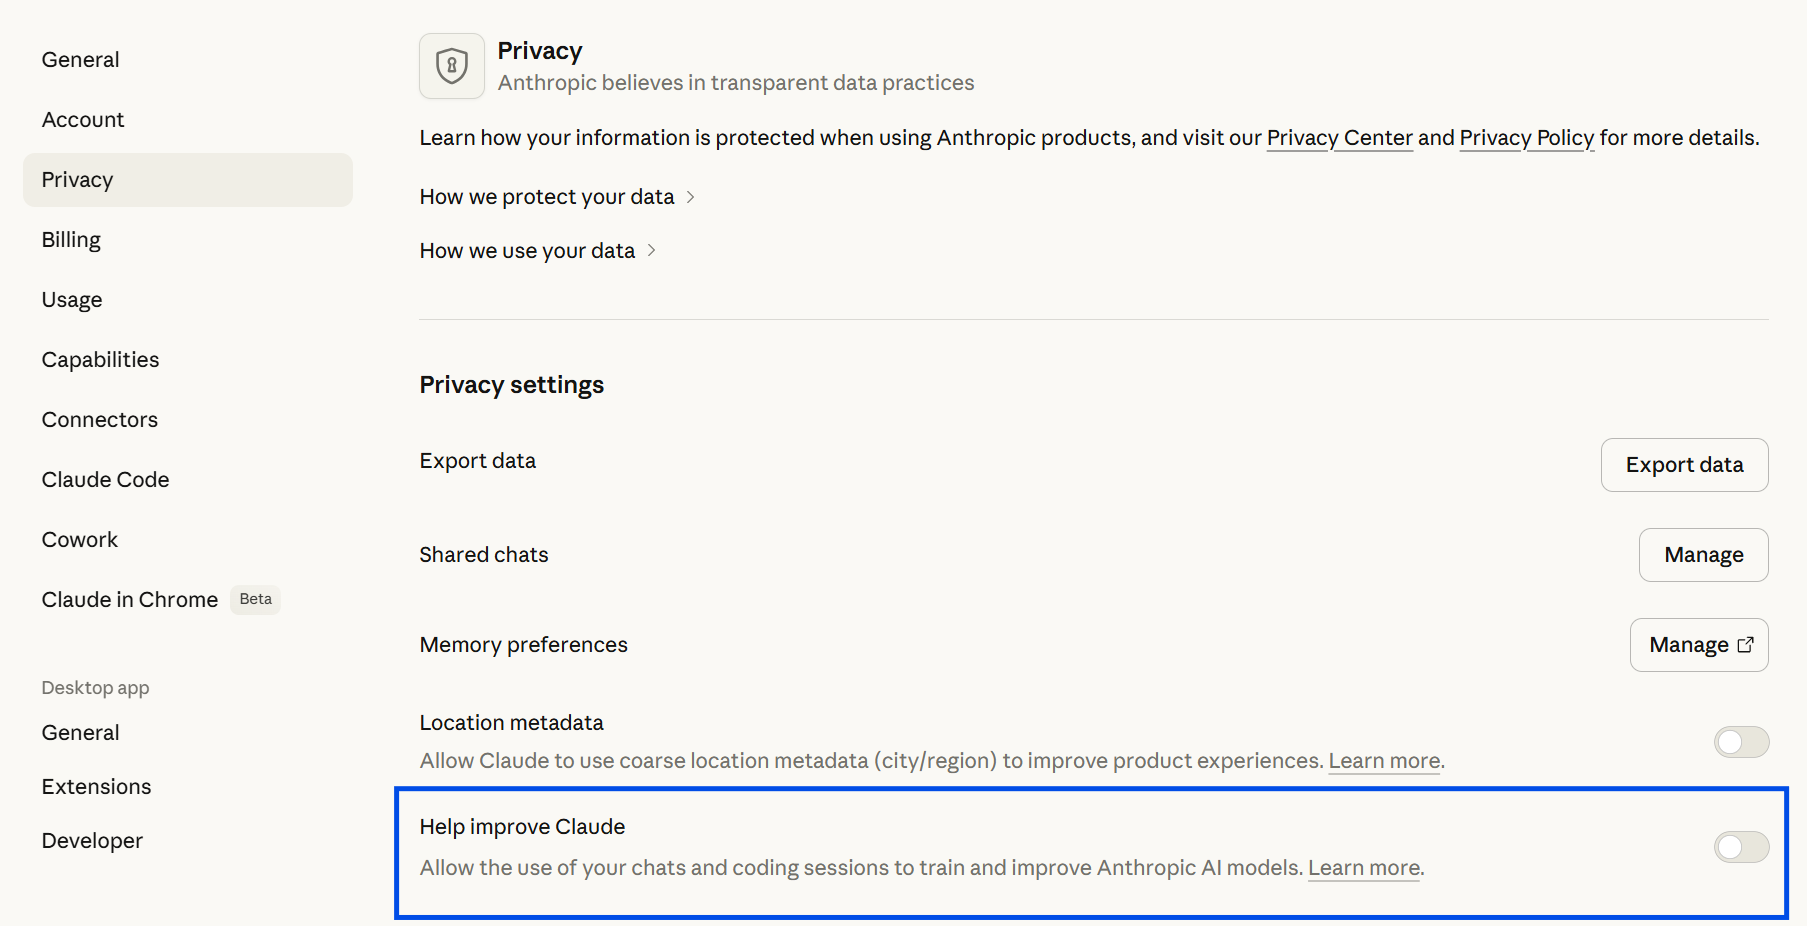
When you run a task, Cowork reads your files locally and transmits them to Anthropic's servers for processing. The output is then written back to your machine. Anthropic may use your data to train its models unless you opt out through your account settings. Go to Settings > Privacy and toggle off the Help Improve Claude option to opt out.
For sensitive files, working with copies rather than live source data is advisable, and is good practice regardless since Cowork has write access to the folder you grant it.
2. Can my entire ops team use it?
Yes. Claude offers Team plans where each person uses their own Cowork instance on their own device. Teams can share files through a common folder and share prompts through a shared document or a skills library, but two people cannot operate the same Cowork session simultaneously. Enterprise licensing is available for broader deployment.
3. Can we automate recurring tasks?
Yes. Cowork's scheduled tasks feature lets you run prompts at set intervals, whether daily, weekly, or monthly. Once an inventory health check or velocity drop prompt is working reliably, scheduling it removes the manual trigger step entirely and the output is ready when you need it.
4. How reliable are the numbers in Cowork’s analyses?
Cowork is highly reliable for well-defined tasks with clear inputs and specific instructions. Errors tend to appear in complex, multi-step prompts that require several inference operations in a single run.
For those tasks, chaining sequential prompts where each output feeds the next input is more effective. It makes the process easier to follow, easier to check, and easier to fix at the specific step where something goes wrong rather than rerunning the entire workflow.
5. What file formats does Cowork support?
Cowork works with CSV, Excel (.xlsx), and PDF files, plus plain text and markdown. For best results, keep your files clean before uploading. Use consistent column headers, standard date formats, and avoid merged cells in Excel.
Note that Cowork can analyze your data and produce tables, charts, and written summaries depending on what your task needs.